Re/max Premier Inc., Brokerage
9100 Jane St
Concord, ON
L4K 0A4


Galway-Cavendish and Harvey, Rural Galway-Cavendish and Harvey, K0M 1A0
$3,299,999$000000
Listed by ROYAL HERITAGE REALTY LTD..
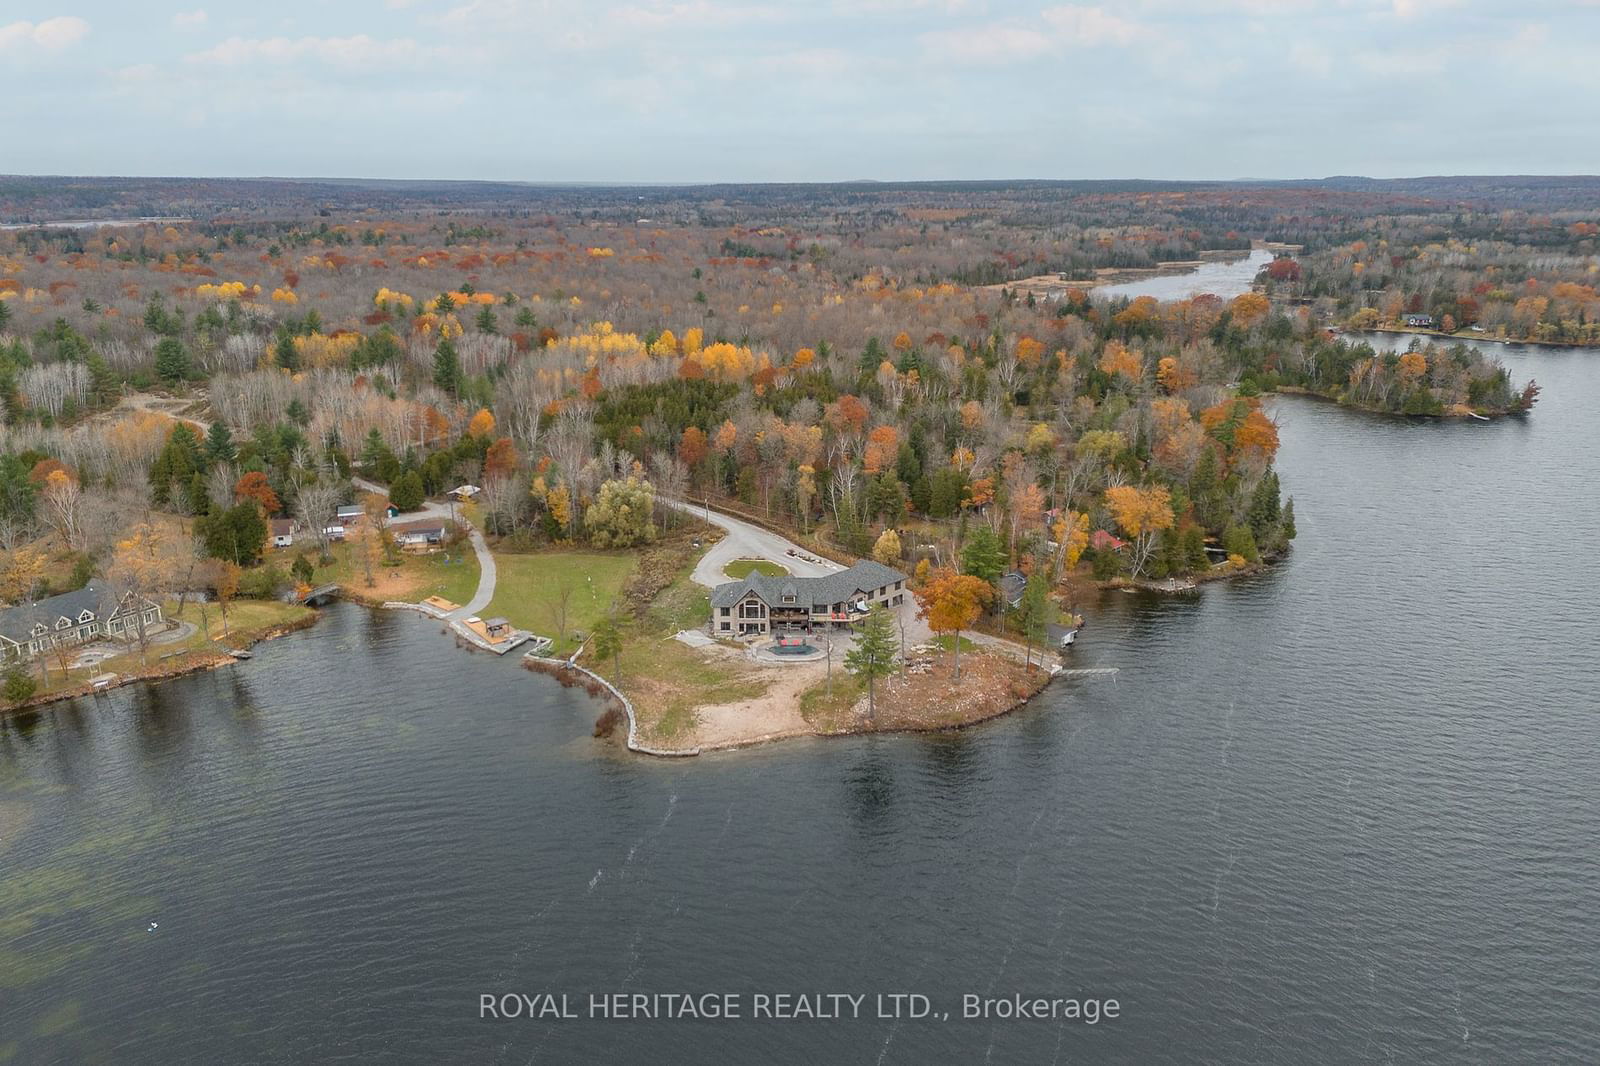
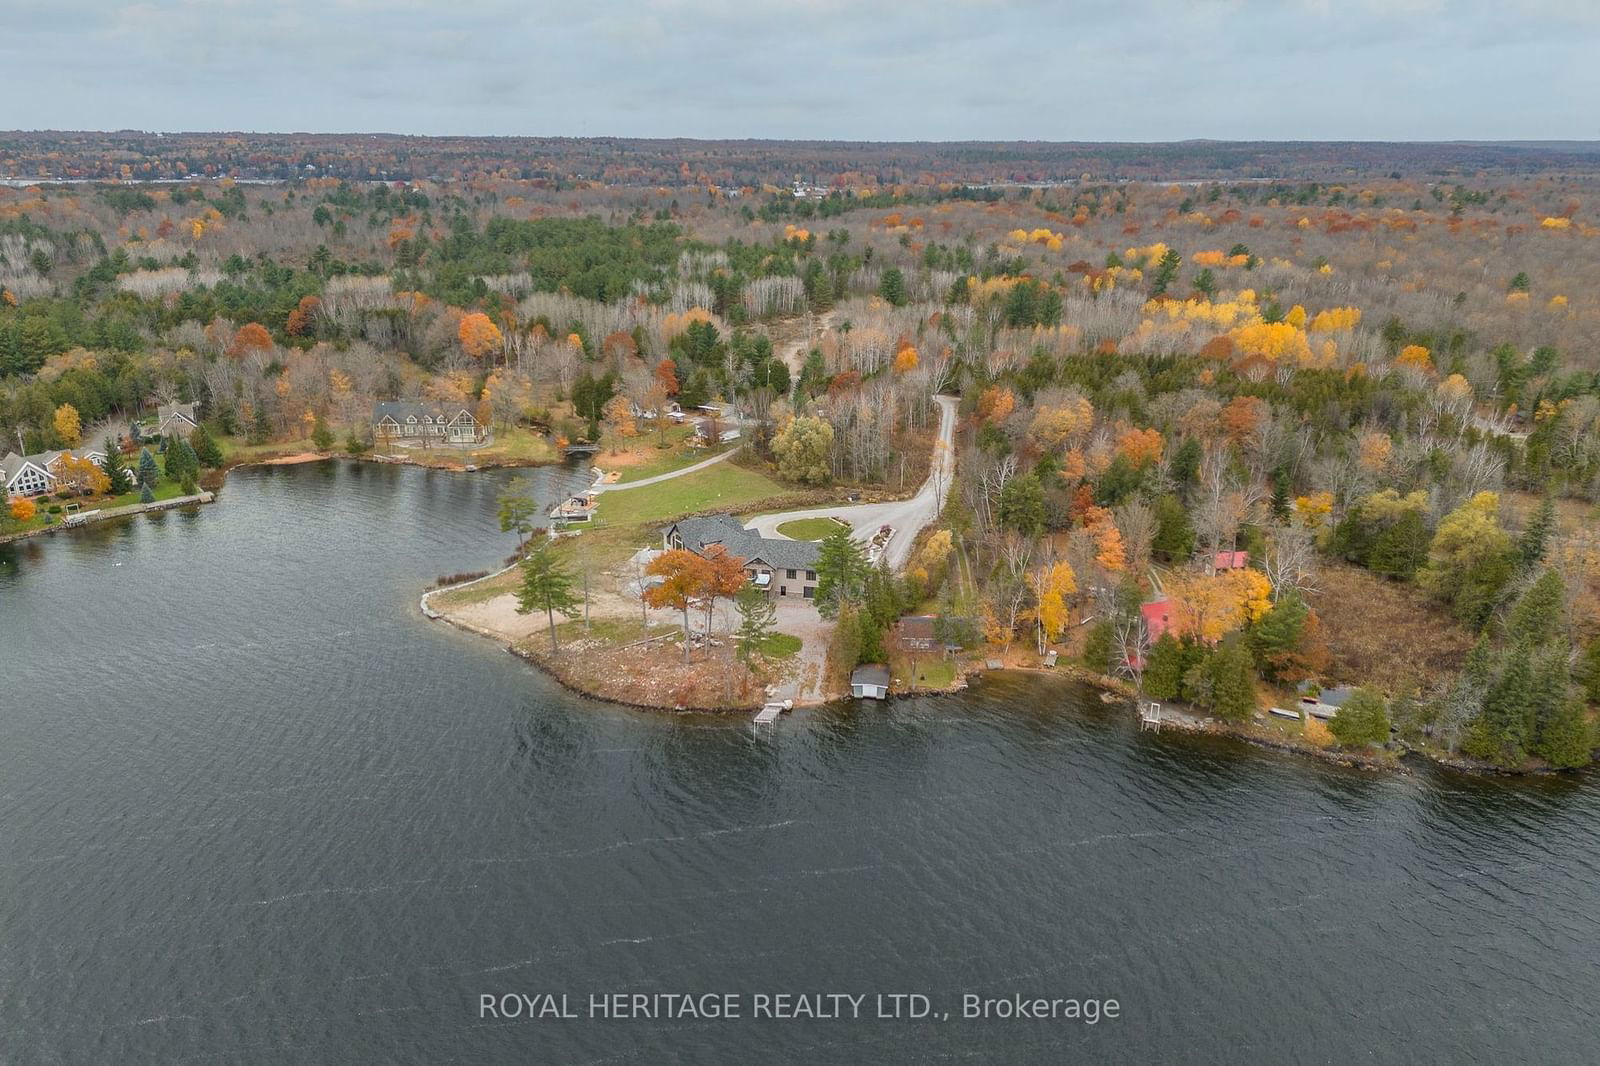
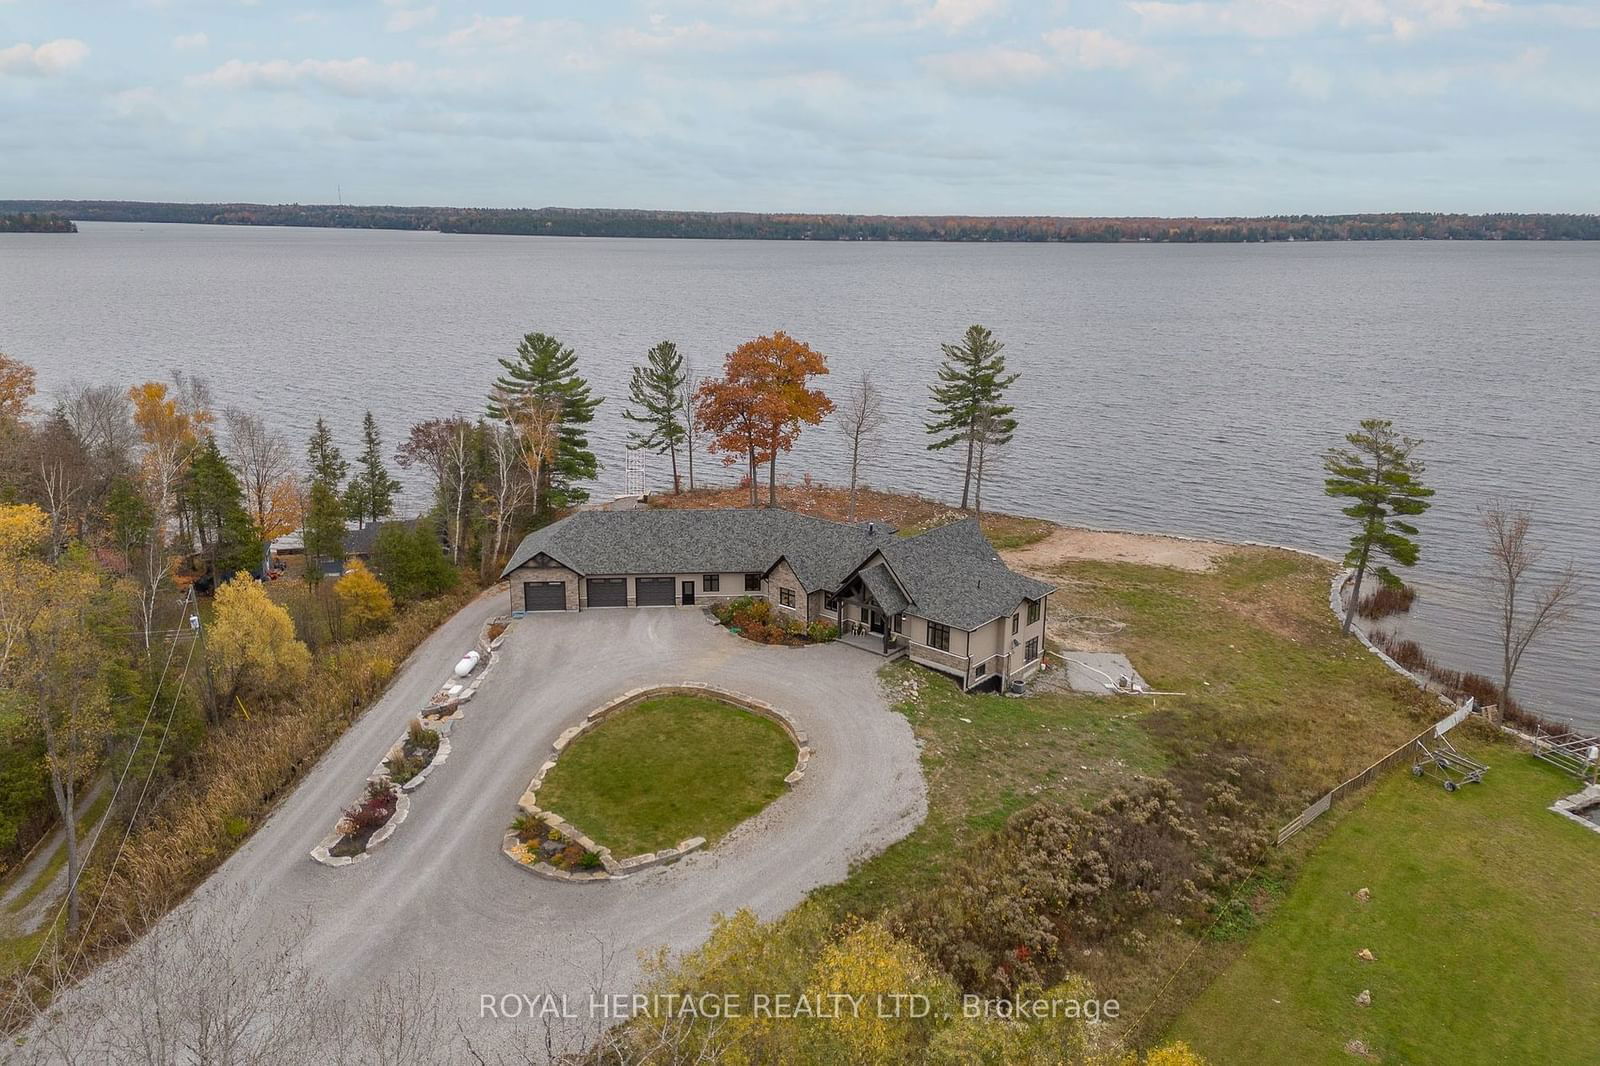
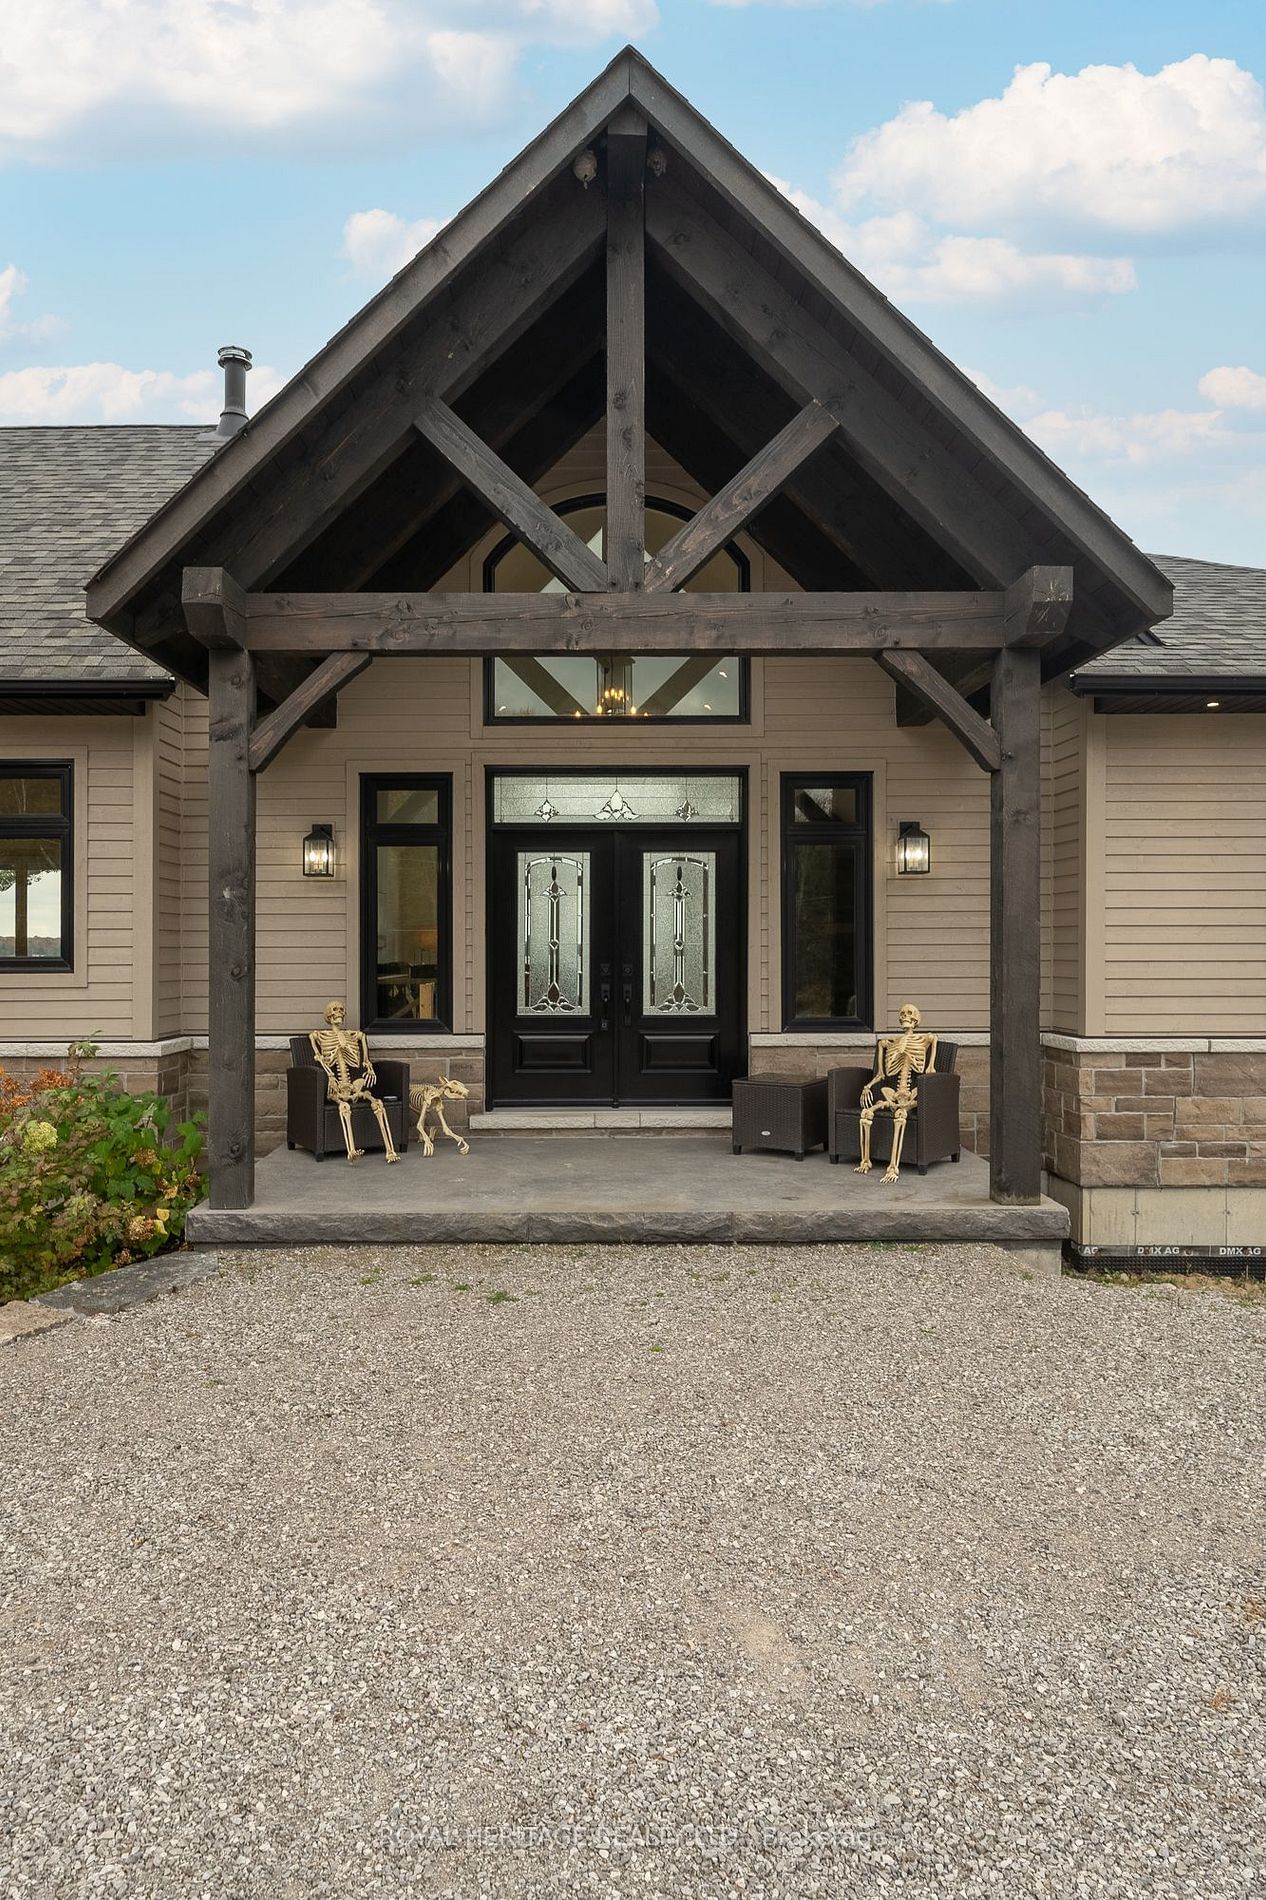
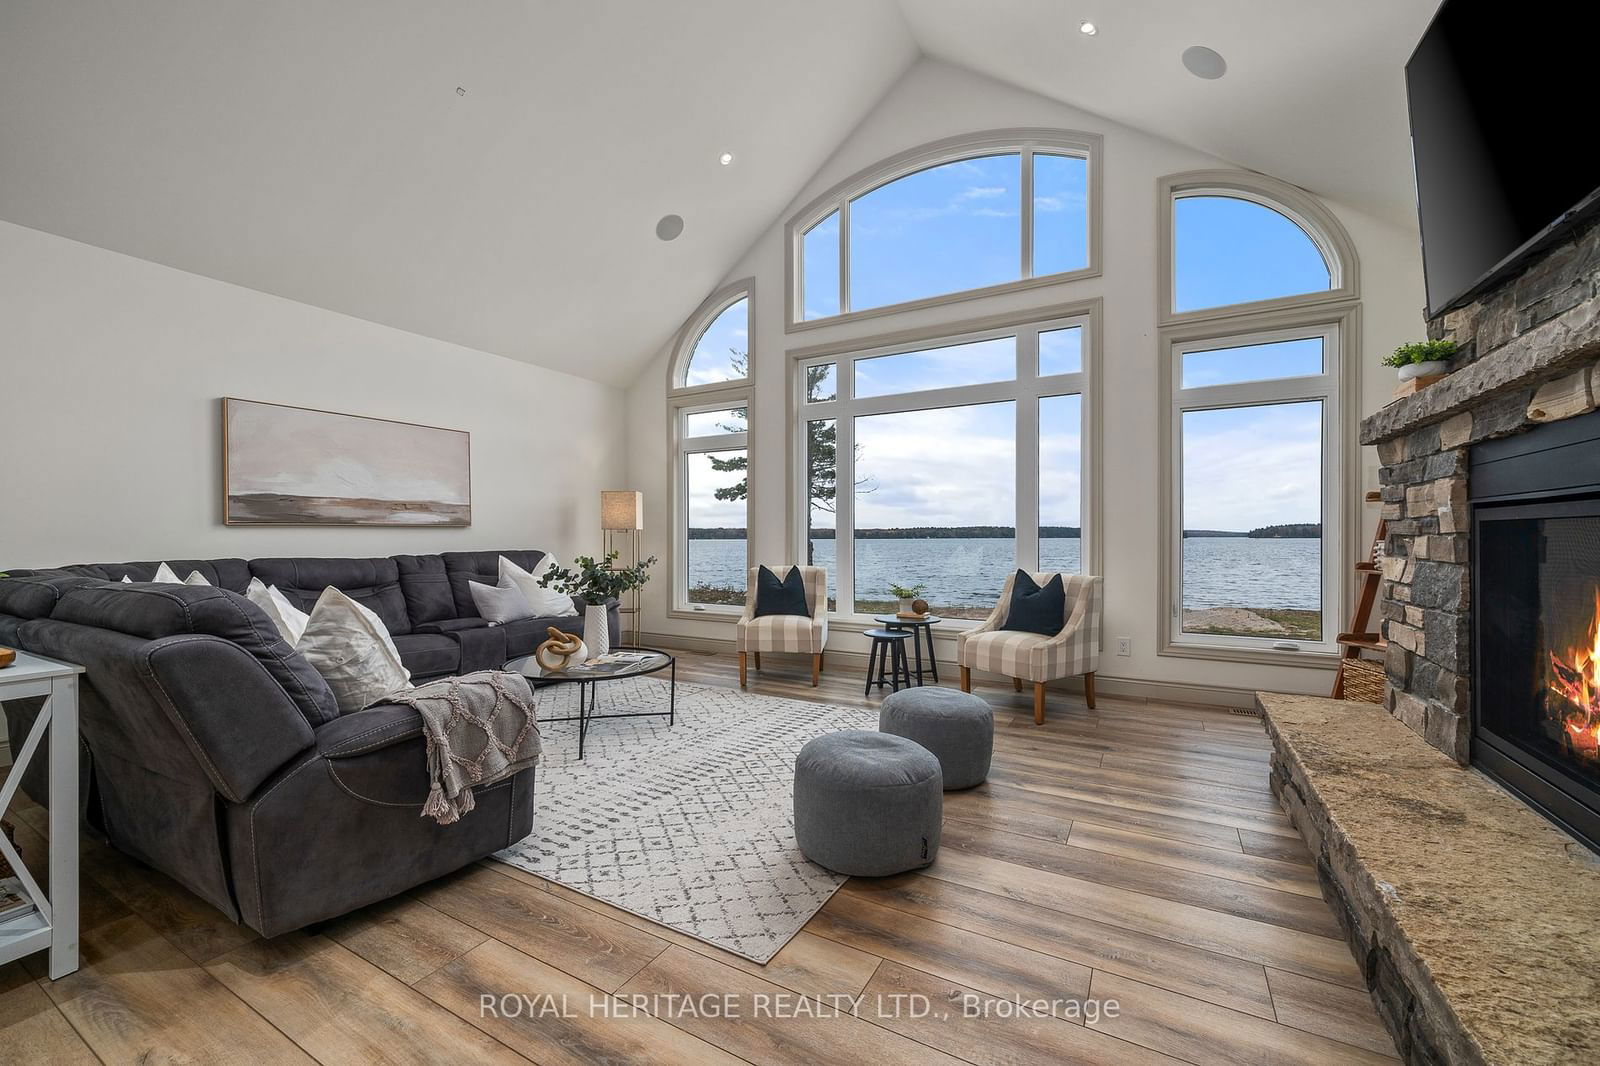
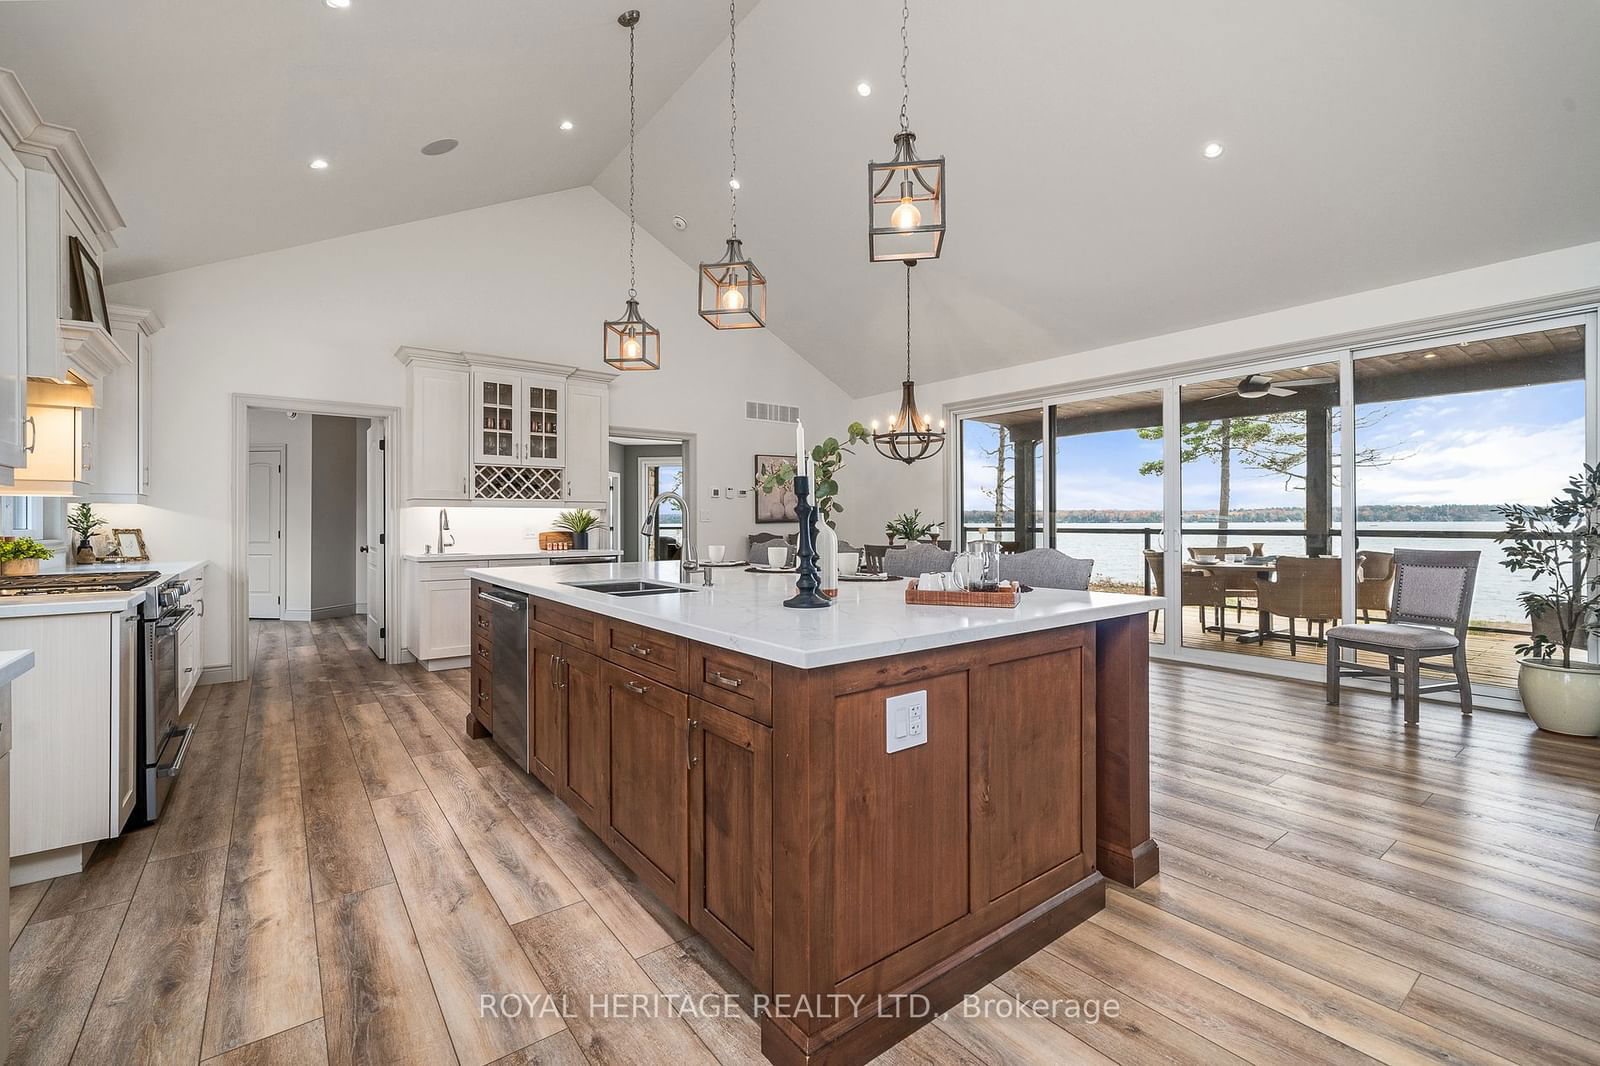
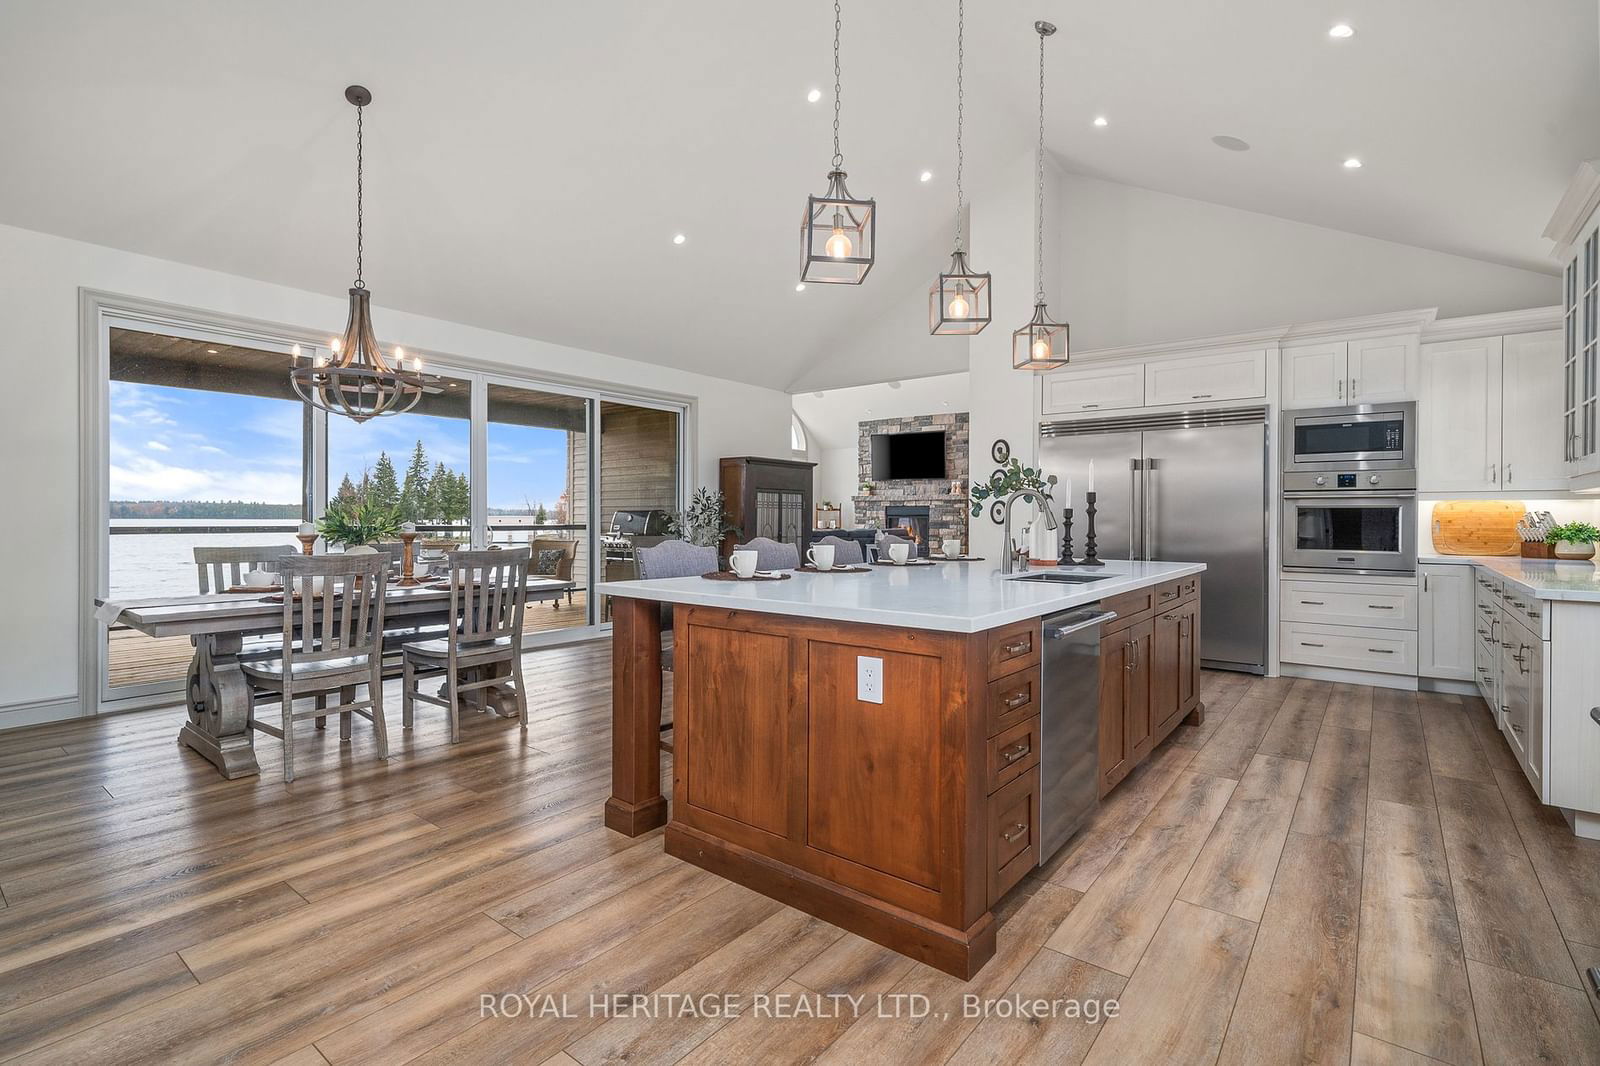
JAW DROPPING EXECUTIVE HOME ON PIGEON LAKE ON 440 FEET OF WATERFRONT WITH DOCKING, POOL & BEACH. Luxury home (B/I 2022) boasting stunning panoramic Pigeon Lake Views and all day Sun situated on a 2 acre point lot w/clean water swimming, wade in sandy beach and direct access to the Trent Severn. Minutes to Bobcaygeon or Buckhorn, 1.5 hrs from the GTA. Open concept floor plan w/soaring cathedral ceilings and floor to ceiling windows that frame Boyd Island to perfection! Kitchen/dining and Primary W/O to outdoor dining areas, private Hot Tub and expansive decks. In floor heating on both levels of this home and garages. Dream kitchen w/massive dining island, high end appliances, butlers pantry and wet bar. Primary Suite overlooking inground pool and Lake boasts ens. w/spa shower, double vanity w/ makeup center plus bespoke soaker tub w/ Lake view. Two guest bedrooms on the M/F and 4 pc. bath adjacent to Great room for privacy when entertaining. Unfinished L/level w/9' ceilings, finished office w/separate entrance, rough in bath, furnace/utilityrm and 2 W/O's to the pool and grounds. Priced with lower level / landscape completion taken into account. Original and new Draft survey showing additional purchased land to accommodate private drive. Road fee $220/yr ~ 2023 Utilities Appx. ~ Hydro: 3550 / PP: 5143 /HWT-Owned. In floor heat throughout. Dual heat source - PP furnace and Napoleon Wood Furnace. Full water purification system / 200 amp w/additional panel for L/L Garage. L/L garage (2 story) to accommodate future hoist option.
Showcase your car collection with style. Thank you for watching the Virtual Tour! Showings Mon to Sat 10-4pm
Foyer
Great Rm
Kitchen
Dining
Prim Bdrm
Bathroom
2nd Br
3rd Br
Bathroom
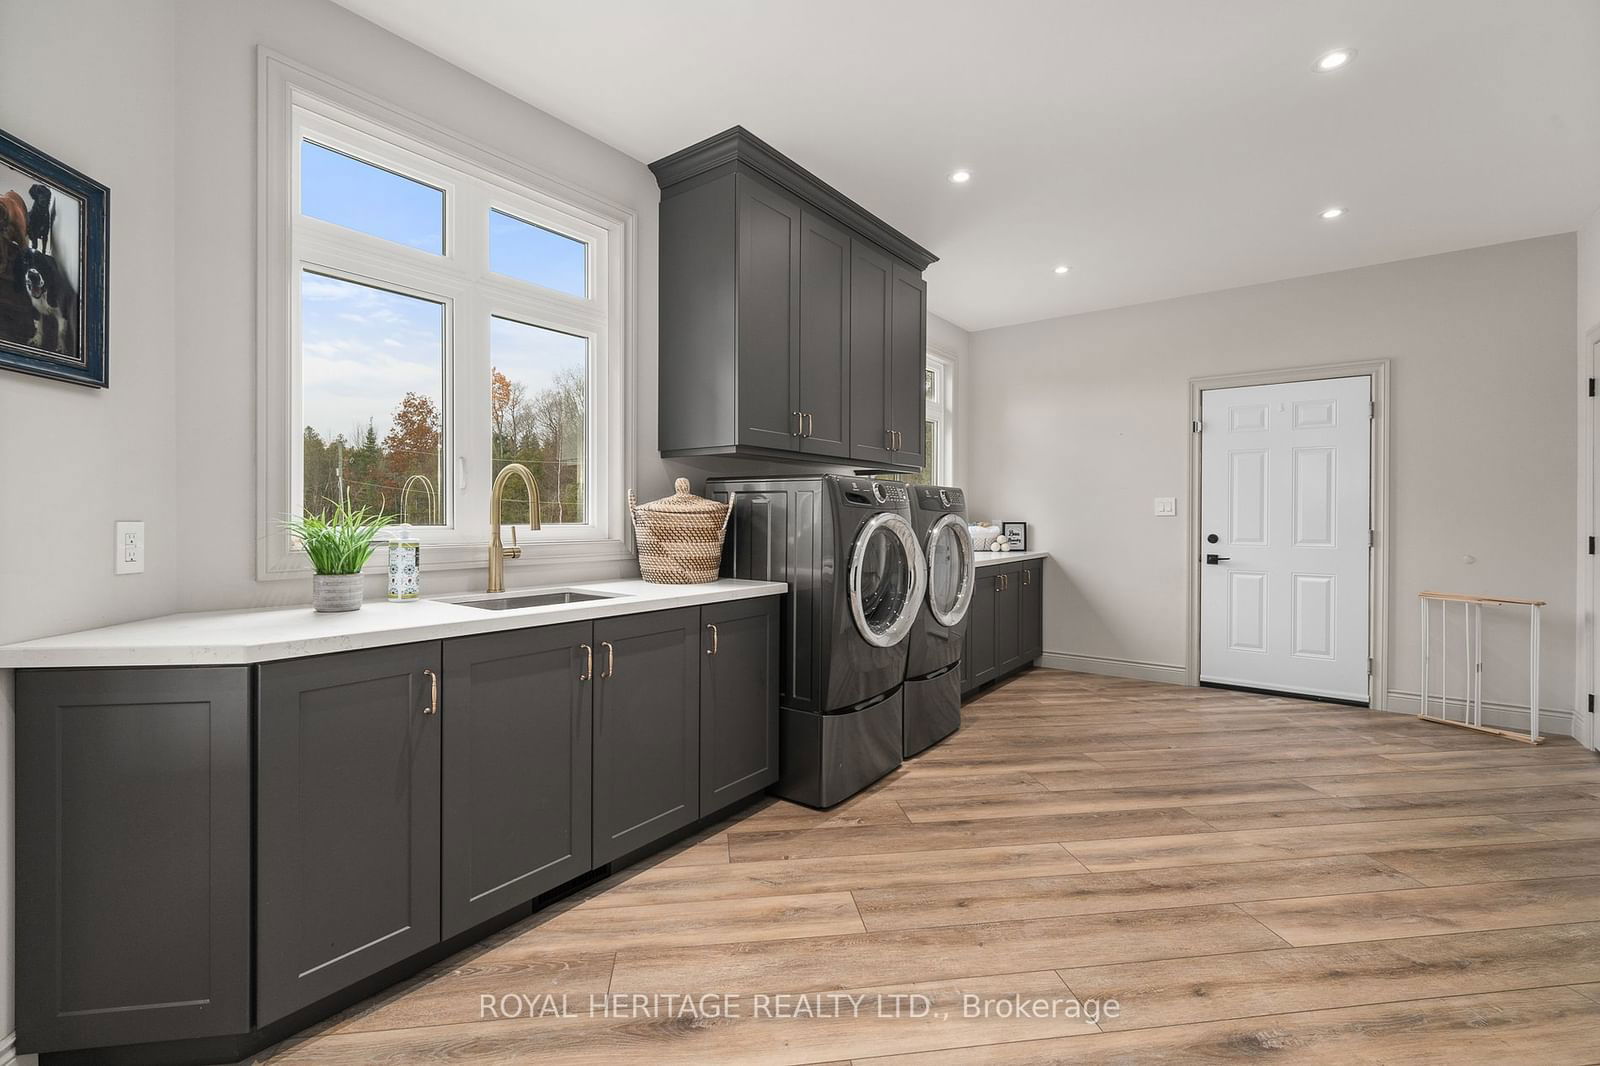
Laundry
Bathroom
Office
The graph below compares the average list price and average sale price of homes in this neighborhood by month for the last 24 months. When average sale price is greater than average list price, this may suggest a buyer's market. When average sale price is lower than the average list price this may suggest a seller's market.
The graph below illustrates the average days on market for homes in this neighborhood. The yellow area may indicate a buyer's market, the green area may indicate a balanced market and the red area may indicate a seller's market.